
The Disengagement Reports for the period December 2017 to November 2018 for all entities operating under a license testing autonomous vehicles on public roads in California is out. The California DMV has published the full list on their website.
In total 48 companies were required to report, and 28 companies, that were actively testing in public, operated 467 vehicles on public roads in California. In total the companies report 496 vehicles, with some companies mentioning no vehicles, although they are known to test on private roads. Many of the companies also operate more test cars in other states and countries.
In total all companies drove in California during that period 2,036,296 miles (3,258,074 kilometers) in autonomous mode and encountered 143,720 disengagements (the moment the system hands back control to a safety driver or when the safety driver interferes).
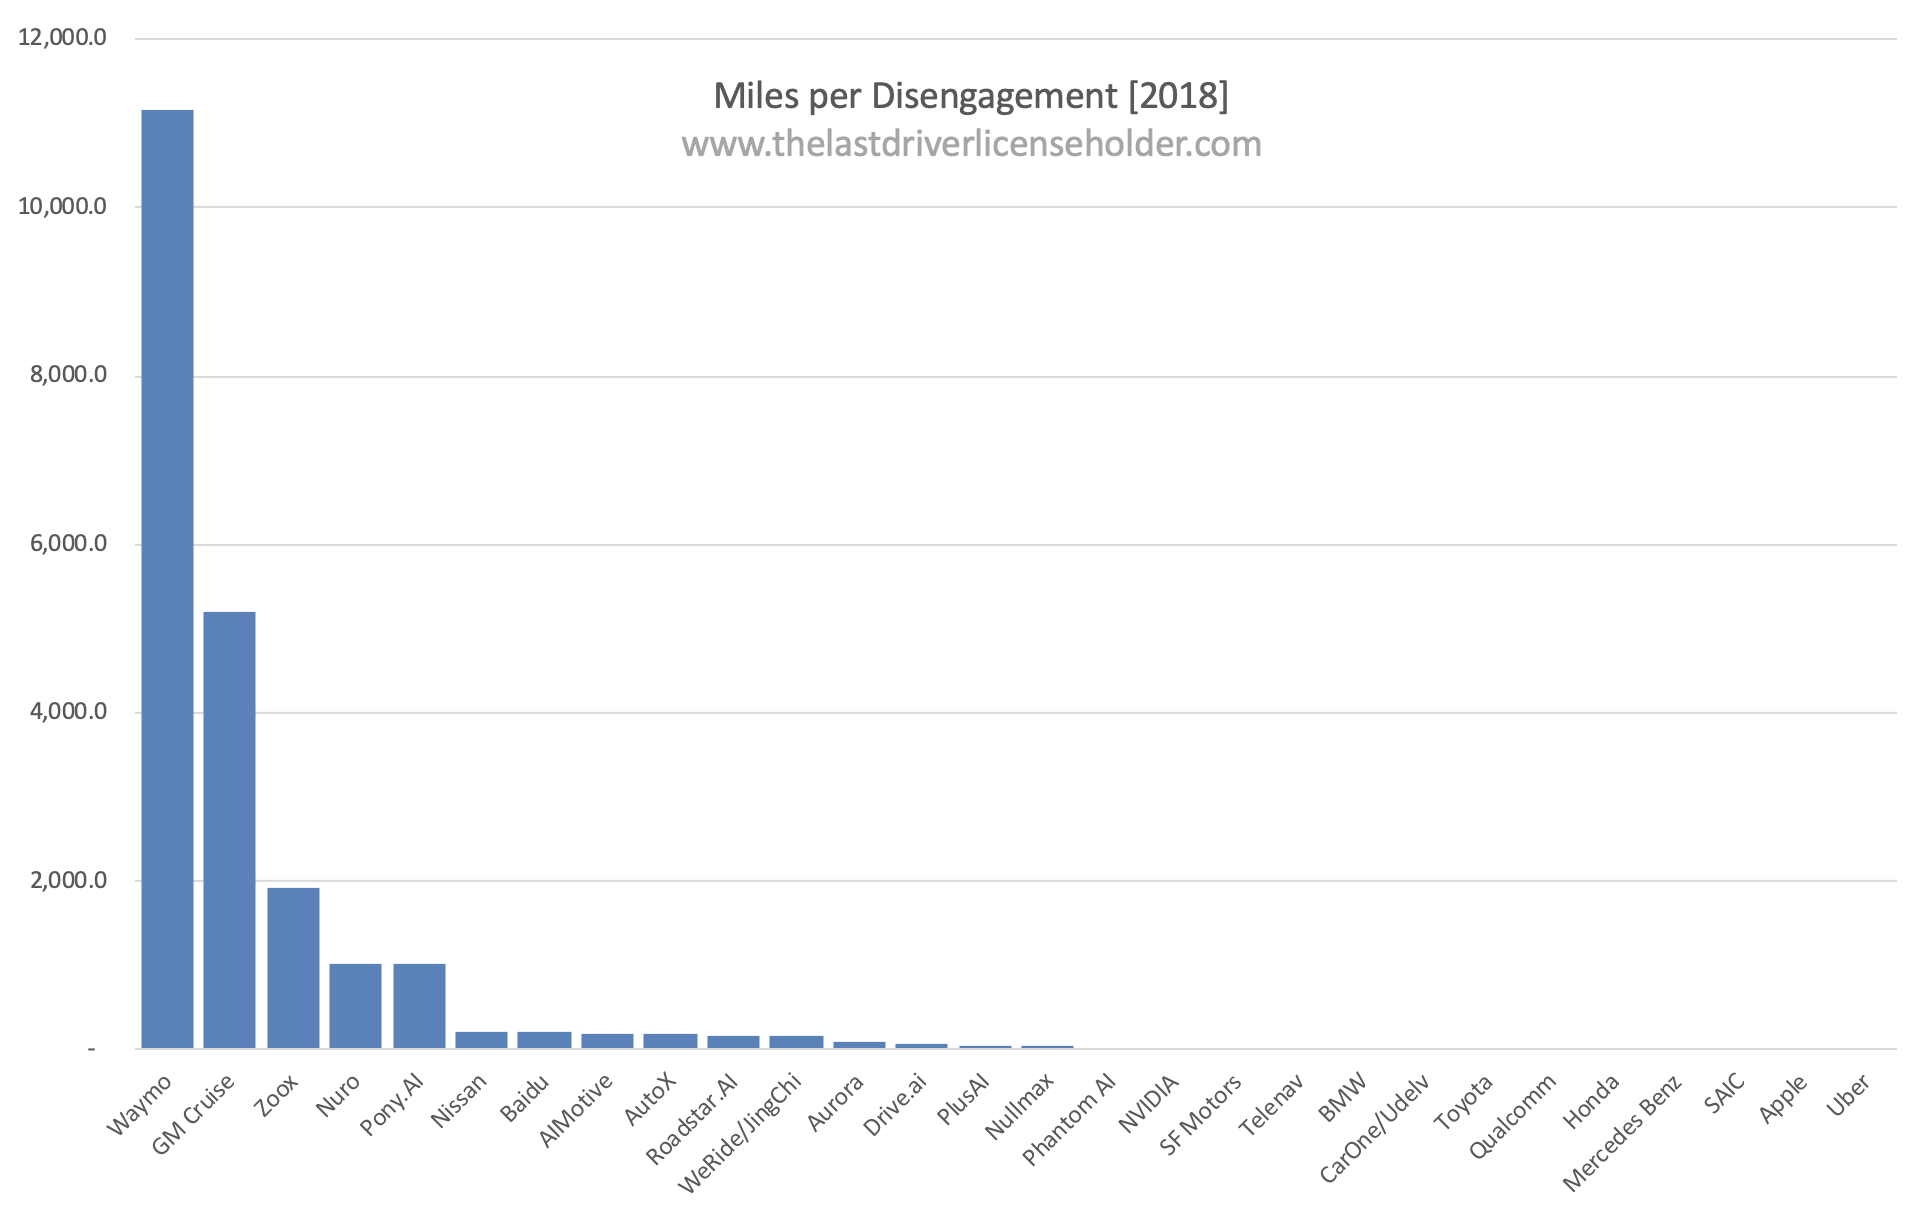
Here is the table with the data sorted by Miles per Disengagement.
| 2018 | Disengagements per 1000 miles | Miles per Disengagement | Disengagements per 1000 Kilometers | Kilometers per Disengagement | Vehicles |
| Waymo | 0.09 | 11,154.3 | 0.06 | 17,846.8 | 111 |
| GM Cruise | 0.19 | 5,204.9 | 0.12 | 8,327.8 | 162 |
| Zoox | 0.52 | 1,922.8 | 0.33 | 3,076.4 | 10 |
| Nuro | 0.97 | 1,028.3 | 0.61 | 1,645.3 | 13 |
| Pony.AI | 0.98 | 1,022.3 | 0.61 | 1,635.6 | 6 |
| Nissan | 4.75 | 210.5 | 2.97 | 336.8 | 4 |
| Baidu | 4.86 | 205.6 | 3.04 | 329.0 | 4 |
| AIMotive | 4.96 | 201.6 | 3.10 | 322.6 | 2 |
| AutoX | 5.24 | 190.8 | 3.27 | 305.3 | 6 |
| Roadstar.AI | 5.70 | 175.3 | 3.56 | 280.5 | 2 |
| WeRide/JingChi | 5.76 | 173.5 | 3.60 | 277.6 | 5 |
| Aurora | 10.01 | 99.9 | 6.26 | 159.8 | 5 |
| Drive.ai | 11.91 | 83.9 | 7.45 | 134.3 | 13 |
| PlusAI | 18.40 | 54.4 | 11.50 | 87.0 | 2 |
| Nullmax | 22.40 | 44.6 | 14.00 | 71.4 | 1 |
| Phantom AI | 48.20 | 20.7 | 30.13 | 33.2 | 1 |
| NVIDIA | 49.73 | 20.1 | 31.08 | 32.2 | 7 |
| SF Motors | 90.56 | 11.0 | 56.60 | 17.7 | 1 |
| Telenav | 166.67 | 6.0 | 104.17 | 9.6 | 1 |
| BMW | 219.51 | 4.6 | 137.20 | 7.3 | 5 |
| CarOne/Udelv | 260.27 | 3.8 | 162.67 | 6.1 | 3 |
| Toyota | 393.70 | 2.5 | 246.06 | 4.1 | 3 |
| Qualcomm | 416.63 | 2.4 | 260.39 | 3.8 | 2 |
| Honda | 458.33 | 2.2 | 286.46 | 3.5 | 1 |
| Mercedes Benz | 682.52 | 1.5 | 426.58 | 2.3 | 4 |
| SAIC | 829.61 | 1.2 | 518.51 | 1.9 | 2 |
| Apple | 871.65 | 1.1 | 544.78 | 1.8 | 62 |
| Uber | 2608.46 | 0.4 | 1630.29 | 0.6 | 29 |
As can be seen, the clear leader is Waymo, which more than doubled the distance until the car needs to disengage (see Disengagement Report from 2017). The first five companies including Waymo, GM Cruise, Zoox, Nuro and Pony.AI reach over 1,000 miles before a disengagement happens. The distance of the sixth-placed company – Nissan with disengagements every 210 miles – are almost worlds apart.
It’s noticeable that for almost all of the total disengagements reported Apple and Uber are accountable with 69,510 and 70,165 of the 143,720 total disengagements respectively (see next list). Either their technologies are that far behind or they don’t give sh*t.
And here a raw list:
| 2018 | Vehicles | Disengagements | Miles | Kilometer |
| AIMotive | 2 | 17 | 3,428.00 | 5,485 |
| AiPod | 1 | – | 31.50 | 50 |
| Apple | 62 | 69,510 | 79,745.00 | 127,592 |
| Aurora | 5 | 329 | 32,858.00 | 52,573 |
| AutoX | 6 | 119 | 22,710.00 | 36,336 |
| Baidu | 4 | 88 | 18,093.00 | 28,949 |
| BMW | 5 | 9 | 41.00 | 66 |
| Bosch | 1 | – | – | – |
| CarOne/Udelv | 3 | 57 | 219.00 | 350 |
| Changan | 1 | – | – | – |
| Continental | 0 | – | – | – |
| CYNGN | 0 | – | – | – |
| Delphi/Aptiv | 13 | – | 287.00 | 459 |
| Drive.ai | 13 | 55 | 4,616.69 | 7,387 |
| Faraday Future | 0 | – | – | – |
| Ford | 0 | – | – | – |
| GM Cruise | 162 | 86 | 447,621.00 | 716,194 |
| Honda | 1 | 77 | 168.00 | 269 |
| Lyft | 0 | – | – | – |
| Mercedes Benz | 4 | 1,194 | 1,749.39 | 2,799 |
| Navya | 0 | – | – | – |
| NIO | 0 | – | – | – |
| Nissan | 4 | 26 | 5,473.00 | 8,757 |
| Nullmax | 1 | 68 | 3,036.00 | 4,858 |
| Nuro | 13 | 24 | 24,680.00 | 39,488 |
| NVIDIA | 7 | 206 | 4,142.00 | 6,627 |
| Phantom AI | 1 | 200 | 4,149.00 | 6,638 |
| PlusAI | 2 | 199 | 10,816.00 | 17,306 |
| Pony.AI | 6 | 16 | 16,356.00 | 26,170 |
| Qualcomm | 2 | 100 | 240.02 | 384 |
| Renovo.auto | 0 | – | – | – |
| Roadstar.AI | 2 | 43 | 7,539.00 | 12,062 |
| SAIC | 2 | 526 | 634.03 | 1,014 |
| Samsung | 2 | – | – | – |
| SF Motors | 1 | 232 | 2,561.80 | 4,099 |
| Subaru | 6 | – | – | – |
| Telenav | 1 | 5 | 30.00 | 48 |
| Tesla | 0 | – | – | – |
| Toyota | 3 | 150 | 381.00 | 610 |
| TuSimple | 2 | – | – | – |
| Udacity | 1 | – | – | – |
| Valeo | 2 | – | – | – |
| VW | 0 | – | – | – |
| Voyage | 0 | – | – | – |
| Uber | 29 | 70,165 | 26,899.00 | 43,038 |
| Waymo | 111 | 114 | 1,271,587.00 | 2,034,539 |
| WeRide/Jingchi | 5 | 89 | 15,440.80 | 24,705 |
| Zoox | 10 | 16 | 30,764.00 | 49,222 |
| Total | 496 | 143,720 | 2,036,296 | 3,258,074 |
Quite a number of companies reported no public testing of autonomous vehicles for the period between December 2017 and November 2018, most prominently Tesla,
Some companies report their disengagement rates, although they are not required. Embark truck reported disengagements every 1,392 miles (2,227 kilometers).
Also see as a reference the Disengagement Report 2017.

too bad you didn’t reference number of accidents per mile, otherwise you wouldn’t opine like this into your article:
“It’s noticeable that for almost all of the total disengagements reported Apple and Uber are accountable with 69,510 and 70,165 of the 143,720 total disengagements respectively (see next list). Either their technologies are that far behind or they don’t give sh*t.”
a simple iron securesearch finds that Waymo seems to have 30% of it’s fleet involved in accidents, so who’s not giving a sh*t about the people it’s killing? If one tries to minimize the times control is given back to the driver, one has more accidents. duh. the first article I looked at showed the GM drive had the most accidents compared to the size of it’s fleet, and since I’m not the one reasearching to publish, I’m not going to go into the math to figure out the accidents per mile, which would be the most important variable, I’d say more important than the number of disengagements… but only if you actually value human life (or animal life for that matter, who knows how many more animals the sistem will not care about to hit)
LikeLike
Well, have you really researched the accidents we\re autonomous cars were involved? Then you will see that the vast majority of accidents were caused by human drivers, not by the autonomous cars. Autonomous cars were being hit by cars with human drivers, with the fault by the human driver.
See here: https://www.axios.com/california-people-cause-most-autonomous-vehicle-accidents-dc962265-c9bb-4b00-ae97-50427f6bc936.html
LikeLike