
New year, new statistics: 19 entities that received a permit for testing autonomous cars from the California DMV submitted their Disengagement Reports. A disengagement is a situation, when an autonomous vehicle gets confused and has to hand over control of the car to a safety driver, or when the safety driver overrules the car.
These 19 companies operated 230 vehicles for test drives in California. The number more than doubled from 2016. Many of the companies operate many more test cars in other states and countries.
| Company | Number of Vehicles |
||
| 2015 | 2016 | 2017 | |
| Baidu | 0 | 1 | 4 |
| BMW | 0 | 1 | 1 |
| Bosch | 2 | 3 | 3 |
| Delphi/Aptiv | 1 | 2 | 1 |
| Drive.ai | 0 | 0 | 7 |
| Ford | 0 | 2 | 25 |
| GMCruise | 0 | 25 | 95 |
| Google / Waymo | 57 | 60 | 75 |
| Honda | 0 | 0 | 0 |
| Mercedes | 5 | 1 | 1 |
| NIO | 0 | 1 | 5 |
| Nissan | 4 | 5 | 5 |
| NVIDIA | 0 | 1 | 2 |
| Telenav | 0 | 1 | 1 |
| Tesla | 0 | 4 | 0 |
| Valeo | 0 | 1 | 1 |
| VW | 2 | 0 | 0 |
| Wheego | 0 | 1 | 0 |
| Zoox | 0 | 1 | 11 |
| Total | 71 | 103 | 235 |
Most interesting is the number of disengagements per miles driven. The numbers are to be taken with a grain of salt, as the companies have some room for interpretation what a disengagement that is worth being reported to the DMV really is.
| Company | Number of Disengagements | Number of Miles driven | Disengagements per 1,000 Miles | ||||||
| 2015 | 2016 | 2017 | 2015 | 2016 | 2017 | 2015 | 2016 | 2017 | |
| Baidu | 48 | – | 1,971 | 24.4 | |||||
| BMW | 1 | – | 638 | – | 1.6 | – | |||
| Bosch | 625 | 1,442 | 598 | 935 | 983 | 2,310 | 668.5 | 1,466.9 | 414.1 |
| Delphi/ Aptiv |
405 | 178 | 81 | 16,662 | 3,125 | 1,811 | 24.3 | 57.0 | 44,7 |
| Drive.ai | 59 | 151 | 6,582 | 22.9 | |||||
| Ford | 3 | – | 590 | – | 5.1 | – | |||
| GMCruise | 181 | 105 | 9,776 | 131,676 | 18.5 | 0.8 | |||
| Google/ Waymo |
341 | 124 | 63 | 424,331 | 635,868 | 352,545 | 0.8 | 0.2 | 0.18 |
| Honda | – | – | – | – | |||||
| Mercedes | 1,031 | 336 | 842 | 336 | 2,239 | 1,088 | 460.5 | 499.3 | 774.1 |
| NIO | – | – | – | ||||||
| Nissan | 106 | 29 | 24 | 1,485 | 4,099 | 5,007 | 71.4 | 7.1 | 4,8 |
| NVIDIA | 109 | 505 | 215.8 | ||||||
| Telenav | 57 | 1,824 | 31.3 | ||||||
| Tesla | 180 | – | 550 | – | 327.3 | – | |||
| Valeo | 215 | 574 | 374.5 | ||||||
| VW | 260 | – | – | 23.912 | 0 | – | 17.4 | – | – |
| Wheego | – | – | – | ||||||
| Zoox | 14 | 3,961 | 3.53 | ||||||
| Total | 2,768 | 2,474 | 450,597 | 656,302 | 507,016 |
||||
The total mileage driven in 2017 dropped in comparison to 2016, which is mainly due to Waymo moving a large portion of its testing to other states, most prominently to Arizona. Waymo drove ‘only’ slightly more than half of the miles in 2016. Other companies have ramped up their own efforts. GM Cruise for instance reached 131,676 miles this year And also other companies such as Zoox, Telenav, Drive.ai or Baidu drove several thousand miles each.
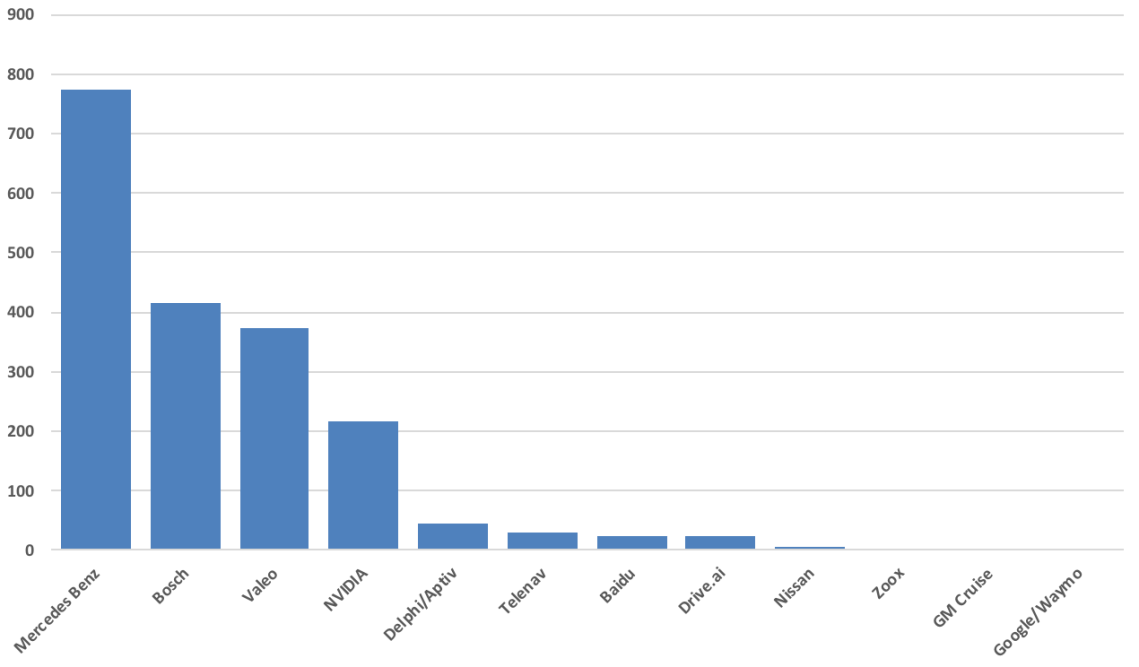
As we can see, Waymo and GMCruise have the by far best disengagement rates. Waymo cars can drive on average over 5,500 miles before the system disengages. GM Cruise cars as second placed on average have to disengage every 1,000 miles and more.
| Company | Miles per Disengagement |
||
| 2015 | 2016 | 2017 | |
| Baidu | – | – | 41.06 |
| BMW | – | 638.00 | – |
| Bosch | 1.50 | 0.68 | 2.41 |
| Delphi/Aptiv | 41.14 | 17.58 | 22.35 |
| Drive.ai | – | – | 43.59 |
| Ford | – | 196.67 | – |
| GMCruise | – | 54.01 | 1,254.06 |
| Google / Waymo | 1,244.37 | 5,127.97 | 5,595.95 |
| Honda | – | – | |
| Mercedes | 2.17 | 2.00 | 1.29 |
| NIO | – | – | – |
| Nissan | 14.01 | 141.34 | 208.36 |
| NVIDIA | – | – | 4.63 |
| Telenav | – | – | 32.00 |
| Tesla | – | 3.06 | – |
| Valeo | – | – | 2.67 |
| VW | 57.48 | – | – |
| Wheego | – | – | – |
| Zoox | – | – | 282.96 |
The worst ranked is Mercedes, which has to hand over almost every mile. Also Bosch doesn’t fare better with every 2 to 3 miles. Considering how long those two companies have been working on autonomous cars, this seems astonishing. But it also shows that developing cars is mostly a software problem and that’s where companies with a software background have an advantage.
The numbers confirm Waymo’s lead and its confidence that had the company now order several thousands of new cars for its autonomous fleets that move beyond testing into operation and deployment. The other companies still have a long way to go to deploy such cars on the streets without creating huge hazards.
This article has also been published in German.

I think you made a mistake with the GM numbers – they have like 80 vehicles.
LikeLike
No, I counted from their Disengagement Report, and it’s 95. They list all cars by name in that report.
LikeLike
GM looks much better if you look at their last 3 months, still not as good as Waymo but much closer.
LikeLike
Let’s look at these numbers with a grain of salt: different companies have different testing methods. Company A may test extensively on private roads, before they release more stable versions to the public road. Company B may have extensive simulation tool chains, drive less miles in CA, or not even the US, or other reasons why numbers are smaller. Company C might test new software more rapidly on public roads and not care too much about the stats. On top, DMV reporting is not consistent across all players: To my knowledge, for example, Waymo recomputes scenes with a disengagement and if this subsequent simulation leads to the result that the car would actually have handled the situation, they neglect the incident.
Given that, DMV stats yield certainly as one coarse (out of many) indicators about the performance of the players.
LikeLike
the worst and nothing
LikeLike